

|
Index page |
|
|
TASK 3SOURCES OF INDOOR CHEMICAL POLLUTANTSQuantification of pollutants levels
Here you can find a summary of the results of different researches about the indoor chemical pollutants. The results are classified according to the chemical pollutant that is released.
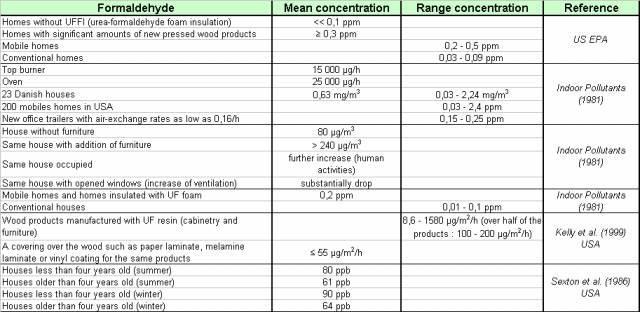
Some observations about these results 1/ Formaldehyde a) Type of homes:
In American studies it has been shown that formaldehyde concentrations were higher in mobile-homes than in conventional homes. This is certainly due to the fact that mobile-homes contain a lot of wood products. b) Insulation:
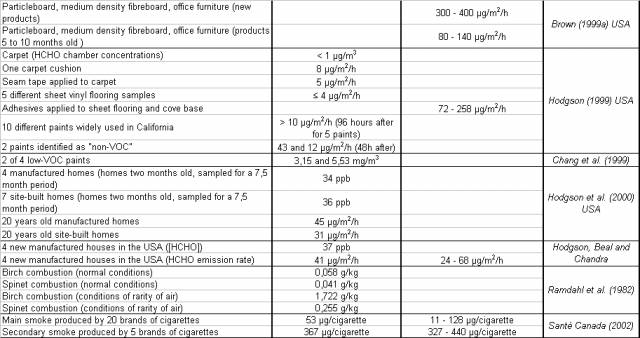
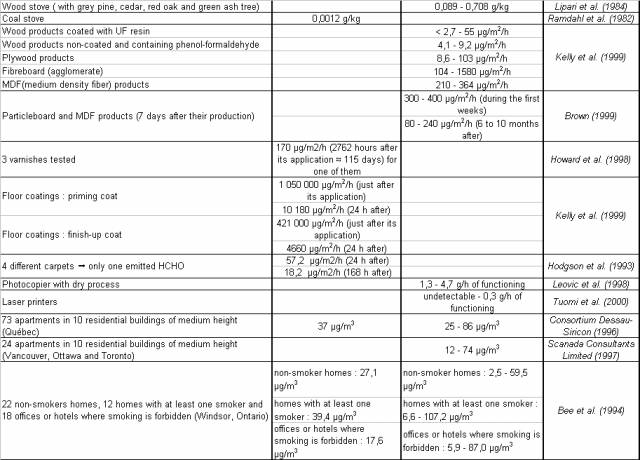
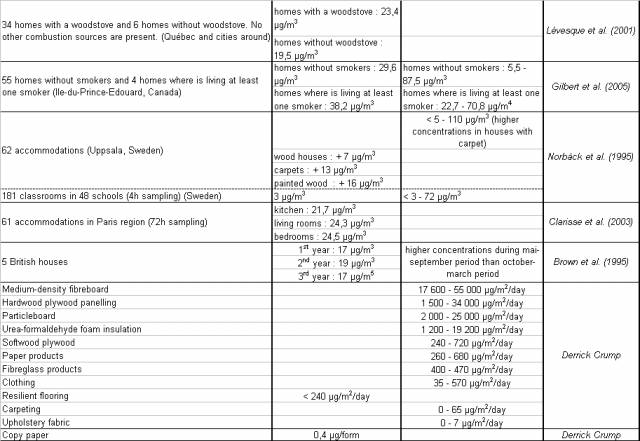
Homes insulated with urea-formaldehyde (UF) foam generate twice more formaldehyde than homes without UF foam insulation (UFFI). So UF foam is a source of formaldehyde. c) Age of house: The formaldehyde concentration decreases when the age of the house increases. Besides, formaldehyde concentrations tend to be higher in winter than in summer (Sexton et al., 1996). It is certainly due to the ventilation which is more important in summer since we open windows more frequently. d) Country: As we can see, homes in But perhaps, the size of the house can be also an explanation. Since there is a cold climate in these countries, maybe the houses are tighter and less ventilated (opened windows). But it is difficult to conclude about these results as they come from different researches and also because the age of houses is unknown. So others factors may have to be taken into account. e) Furniture and presence of humans: In general, wood products increase the formaldehyde concentration. The coating of the wood product is also a factor of the increase of the formaldehyde concentration: wood products coated with UF resin release more formaldehyde than wood products non-coated and containing phenol-formaldehyde. Plywood products, fibreboard, MDF products, paper products and fibreglass also increase the formaldehyde concentration. It is the same thing for some floor coverings (carpet, vinyl flooring, and resilient flooring); upholstery fabric, curtains, clothing but also for paints even the paints identified as “non VOC” or “low VOC”; varnishes; and office equipment (HCHO emissions were 9 times higher when the computer was on than when it was off, Funakie et al. (2003)). Nagawaka et al. (2003) have shown that cathode ray tube (CRT) monitors had slightly higher emissions raetes of formaldehyde and acetaldehyde than thin film transistor (TFT) monitors. They emit formaldehyde due to their composition, their capacity to adsorb some chemicals (carpet, curtains…) and release them after, and due to the household products applied on their surfaces (wax, varnish…). Sine a research overtaken in 1981, a house without furniture had a formaldehyde concentration of 80 μg/m3. The same house furnished had a formaldehyde concentration of more than 240 μg/m3. And when the house was occupied, there was a further increase for the formaldehyde concentration. But when windows were opened, researchers noted a substantially drop because of the increase of ventilation. So, human activities (for example cooking) are responsible for the increase of the formaldehyde concentration. f) Age of building materials:
It has been shown through different researches that the formaldehyde concentration decreases when age the building materials increases. g) Combustion sources:
Combustion sources are a source of formaldehyde. We can also note that emissions in homes with a wood stove are more important than emissions in homes without a wood stove. Besides, according to the type of wood used, the emissions can vary. A wood stove emits more formaldehyde than a coal stove. h) Smoking: Tobacco smoke is another source of formaldehyde. Secondary smoke emits more formaldehyde than main smoke. 2/ VOC a) Type of homes: According to some researches, emissions of VOC in site-built houses are higher than in manufactured homes. b) Age of homes:
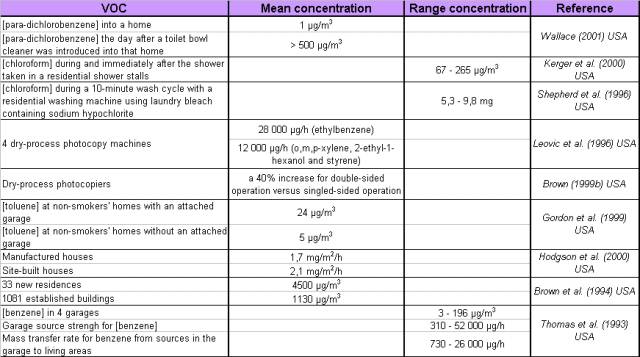
The VOC emissions are more important in new residences than in established buildings. So, the VOC emission decreases with the age of the houses. c) Presence of an attached garage:
There are more VOC in non-smokers’ homes with an attached garage than in non-smokers’ homes without an attached garage. As you can see on the graph, VOC are even more important when there are cars parked inside the garage. d) Household products:
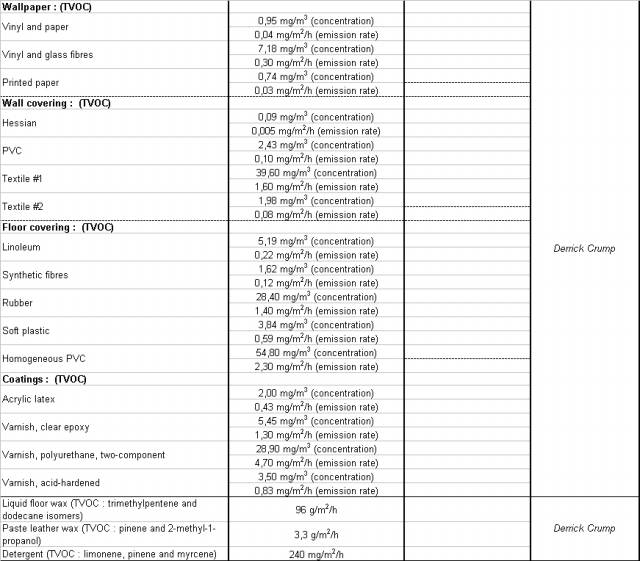
They contribute to the increase of VOC concentrations in a house. Liquid floor wax has a higher VOC emission rate than a detergent. e) Buildings furniture:
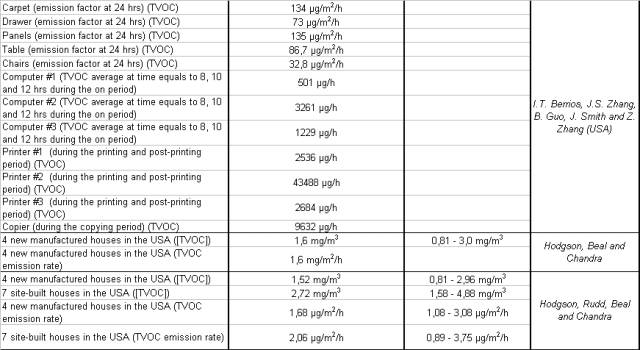
First, the office equipment includes computers, printers and copiers. They are called “active sources” because they also emit heat as well as pollutants. Their emissions depend on the operation modes as well as the materials used. Emissions rates for the computer were 10 to 120 times higher when the computers were on than off. Simulations indicated that operation of the copier, printer and computer would contribute most of the total TVOC and toluene concentrations in a typical office environment. But different computers and printers may have very different compounds emitted. In every computer tested, there were m-xylene, p-xylene, pentadecane, phenol, toluene and unidentifiable VOC. VOC emission rates of monitors decreased as a result of ageing (Wensing et al. (2002)). Toluene is the only common VOC found in every printer test. Printers and copiers are the office sources with the highest emission factors. Their emission factors increase quickly during the copying and printing period and they kept at relatively high level during the post-printing and post-copying periods. The “off” and “idle” periods can be negligible compared with the printing and copying periods. Concerning the computers tests, their emission factors increased during the first hours in the “on” period, and then approached their relatively stable values. Now, concerning the buildings components such as carpet, drawer, panels, table and chairs, that are also called “passive” sources. The most common VOC identified for “passive” sources was d-limonene and it was present in 60% of the tests. The VOC higher emission factors were in the first 24 hours and after that they decrease quickly approaching their quasi-steady state. “Passive” sources have lower emission factors than “active” sources. The chairs have the lowest emission factor among the test product. Emissions from furniture components decreased slowly over time, following a power-law decay curve. f) Building materials:
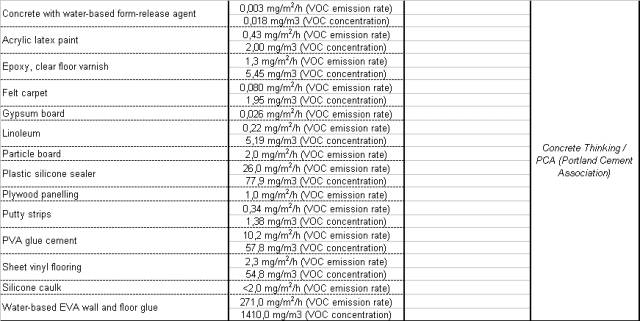
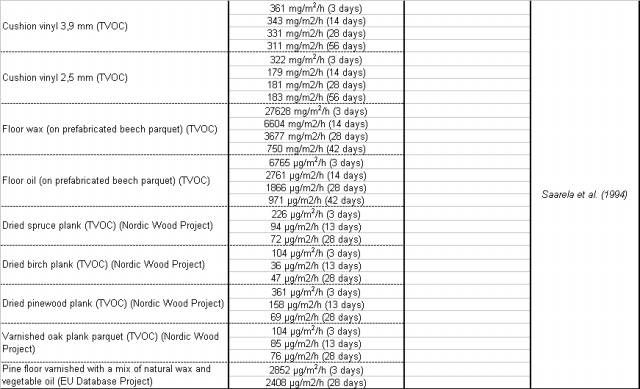
The following graphs represent VOC emission from different flooring materials among time. As you can see, the floor wax on prefabricated beech parquet has the highest emission factors. Cushion vinyl has also high emission factors. The dried birch plank (and dried plank in general) has the lowest ones. The thickness plays a role in the VOC emissions because cushion vinyl 3,9 mm has higher emissions than cushion vinyl 2,5 mm. Then concerning the floor product applied, we can note that a floor wax emits more VOC than a floor oil. Besides, pine floor varnished with a mix natural wax and vegetable oil has no negligible emissions even if it is varnished with natural products. So, natural products also contain some VOC. As I have said the dried wood planks have the lowest emission factors. But the type of wood used influences the emission factor (birch releases less VOC than spruce or pinewood). So, this study shows that vinyl flooring releases more VOC than wood flooring. Another study about different floor coverings shows that homogeneous PVC has the highest VOC emission factor (but it is also the highest VOC containing product). Rubber also contains a lot of VOC. Synthetic fibres appear to be the floor covering containing the least of VOC. Now, concerning the wall papers, it is the vinyl and glass fibres paper that has the highest concentration of VOC. From the different wall covering tested, PVC and some textiles may have the highest emission factors. For coatings, varnish coatings release in general higher VOC than acrylic latex coatings. The varnish composed with polyurethane and two components, is the highest VOC containing varnishes. Finally, this graph is about different building materials. We can note that materials which are made with plastic, vinyl or which use glues have the highest VOC emissions. So this shows that it is important to choose the right material with the lowest chemical pollutant emissions. 3/ CO a) Type of places:
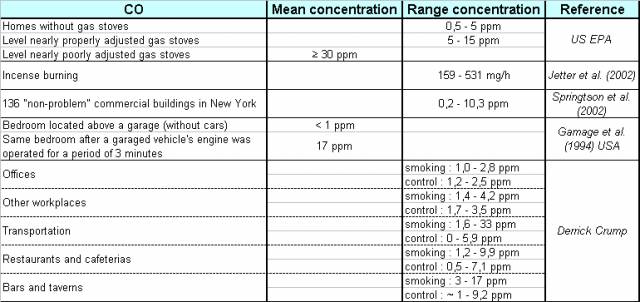
CO concentrations were measured in different indoor places. Measures were made both in a smoking area and in a control area. Smoking always increases the CO concentration, especially for transports. In control area, bars and taverns contain the more VOC. But restaurants and cafeterias have also high level of CO. Offices have the lowest concentration of CO both in smoking area and control area. So, CO concentration is likely to be influenced by cooking sources because the highest levels were in eating places. When there are smokers, CO concentration is the most important in transports, perhaps because transport area is tighter and less ventilated than the other places tested. b) Gas stoves:
Homes without gas stoves have lower CO concentrations. So, gas stoves are a source of CO. Besides, it is important to have a properly adjusted gas stove. Because if the gas stove is not well maintained, the CO concentration in homes increases. c) Garage:
Like the VOC concentration, CO concentration increases in houses with an attached garage. 4/ NO2 a) Type of places:
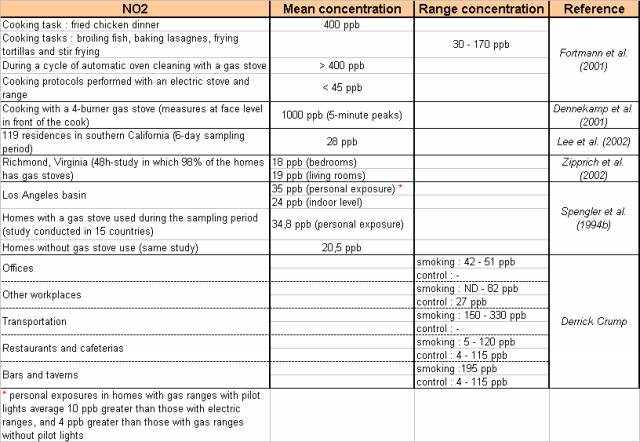
As it was said before for the CO concentrations, smoking increases NO2 concentrations in every type of places (but no data is available for control area in offices and transportation). It is still smoking area in transportation which is the highest. In control area, restaurants and cafeterias, bars and taverns have still the highest NO2 concentrations. So, once again we can note the negative impact on chemical concentrations. Cooking sources may also have a negative impact on NO2 concentrations according to NO2 level in control area in eating places. Cooking tasks such as fried chicken dinner, broiling fish, baking lasagne, frying tortillas or stir frying emit high level of NO2. b) Gas stoves:
Homes with gas stoves have highest NO2 level than homes without gas stoves. So, combustion sources such as gas stoves increase the NO2 concentration in buildings. 5/ PM (Particulate matter) a) Gas stoves and electric stoves:
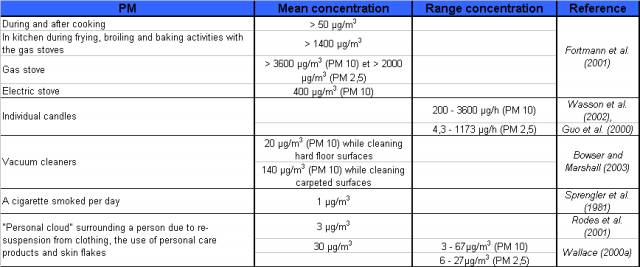
Fortmann et al. (2001) have shown that gas stoves emit more PM (> 3600 μg/m3) than electric ones (400 μg/m3). b) Cooking:
During and after cooking, PM level in homes increases. PM level is very high during frying, broiling and baking activities with the gas stoves. c) Smoking:
Cigarettes are also a small source of PM. However, a candle surprisingly emits a lot of PM (more than one cigarette).
d) Vacuum cleaners:
Vacuum cleaners produce particulate matter and PM emissions are higher while cleaning carpeted surfaces than while cleaning hard floor surfaces. Thus, carpeted surfaces contain more PM than hard floor surfaces, due to its capacity of adsorption of chemical pollutants. e) Personal clouds:
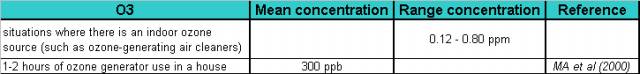
Researchers have shown that humans also increase the PM level in homes (Rodes et al. (2001), Wallace (2000a). This is due to the re-suspension from clothing, the use of personal care products and skin flakes. PM levels from personal clouds are not negligible especially when there are many people in a building. 6/ Ozone (O3) a) Office equipment:
Printers, copiers and fax machines are important sources of ozone. b) Air-cleaning device:
It is also called ozone generator. Whereas it is supposed to “clean” the air, this device produces high level of ozone even if during short period of functioning. 7/ Pesticides a) Places:
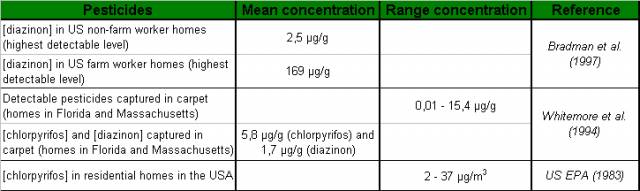
Pesticides concentrations are more than 60 times higher in farm workers homes than in non-farm workers ones. So, outdoor contribution is very important for indoor pesticide levels. b) Carpets:
Pesticides are captured by carpets and these latter can release them after for a long time. 8/ PAH (Polycyclic-Aromatic Hydrocarbon) a) Combustion sources:
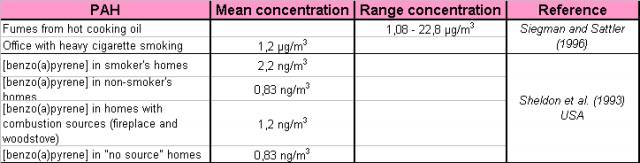
Homes with combustion sources, such as fireplace or wood stove have highest level of PAH than homes without combustion sources. So, combustion sources generate PAH. b) Cooking: In homes, fumes from hot cooking oil contain PAH. So, cooking is also a source of PAH. c) Smoking:
In smokers homes, PAH level is more than twice higher than in non-smokers homes. So, smoking increases significantly PAH level.
You can send comments : aub@niras.dk
Started by NIRAS supervisor Sergio Fox on 27th March 2006. © COPYRIGHT 2001 ALL RIGHTS RESERVED Aurelie.dk |